
Rapid Analytics for Disaster Response
Rapid Analytics for Disaster Response
When disaster strikes, assessing hazard extent and damage is the first step toward restoring community lifelines
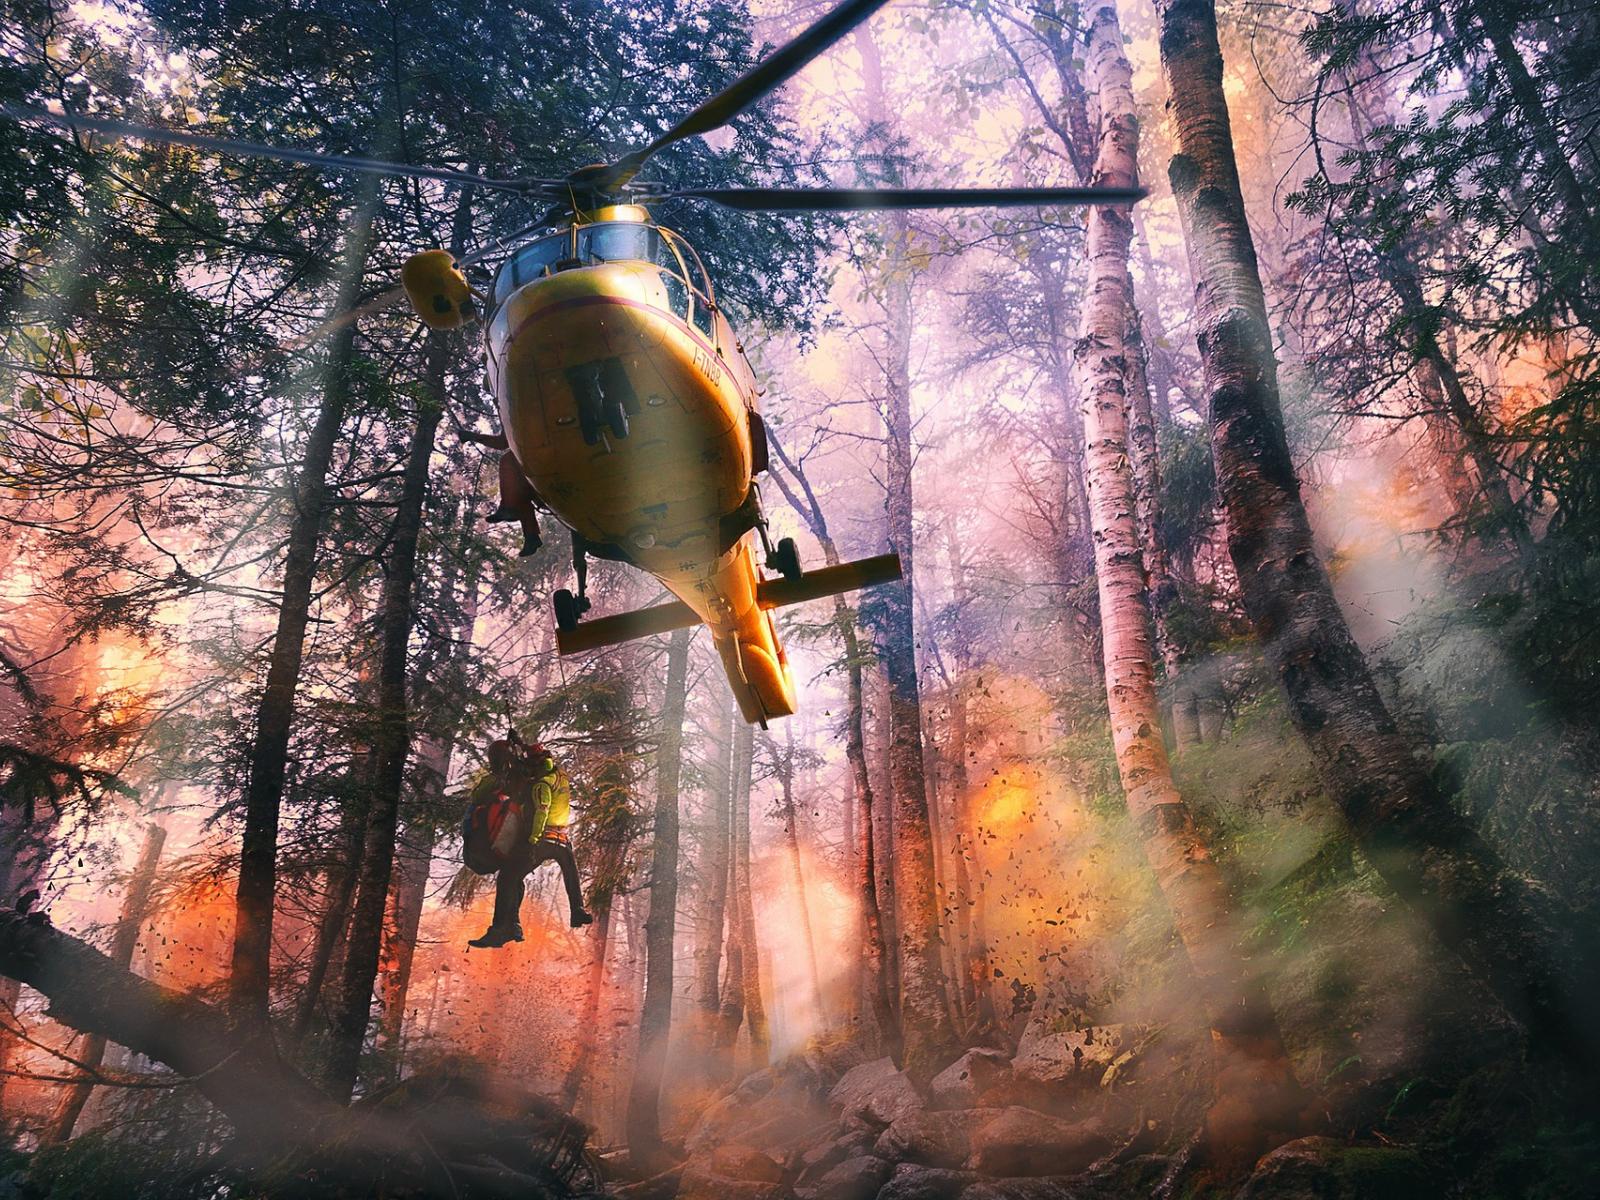
RADR, developed by PNNL, combines photos and imagery capturing technology with AI to help first responders battle wildfires and preserve key infrastructure.
(Image by ThePixelman | Pixabay.com)
The Rapid Analytics for Disaster Response (RADR) software suite (RADR-Fire copyright: IPID 3247), an R&D 100 award-winning technology, is an all-hazards detection system that combines multi-modal imagery, artificial intelligence (AI), and scalable cloud computing with an infrastructure damage assessment tool to understand current impact and risk to infrastructure from wildfires, floods, hurricanes, earthquakes, and more. The system is built to deliver high-resolution, high-cadence, large-extent situational awareness for incident command and disaster management teams to understand hazard extent, communities affected, impacts to critical infrastructure, blocked transportation routes, structural damage, and safe locations to establish relief efforts. All algorithms in RADR have been developed based on community requests.
Rapid Assessment Through AI Analytics
Designed by researchers at Pacific Northwest National Laboratory (PNNL) in 2014 and used on hundreds of events, the RADR disaster response and situational awareness tool automatically combines imagery collected by many different high-resolution (0.1–10 m pixel resolution) satellite, airborne, drone, and social media platforms and applies AI-based image analysis algorithms to detect hazards, damage, and risks to community lifelines. Using satellite-based infrared and microwave radar sensors, it is possible to “see” through wildfire smoke and thick hurricane cloud cover at times when ground crews, aircraft, and drones cannot deploy. Once imagery is available, the resulting analytics are made available within minutes and are delivered in GIS-ready web service formats that can be ingested into your own analytic and modeling workflows.
Focus On Wildfire – RADR-Fire
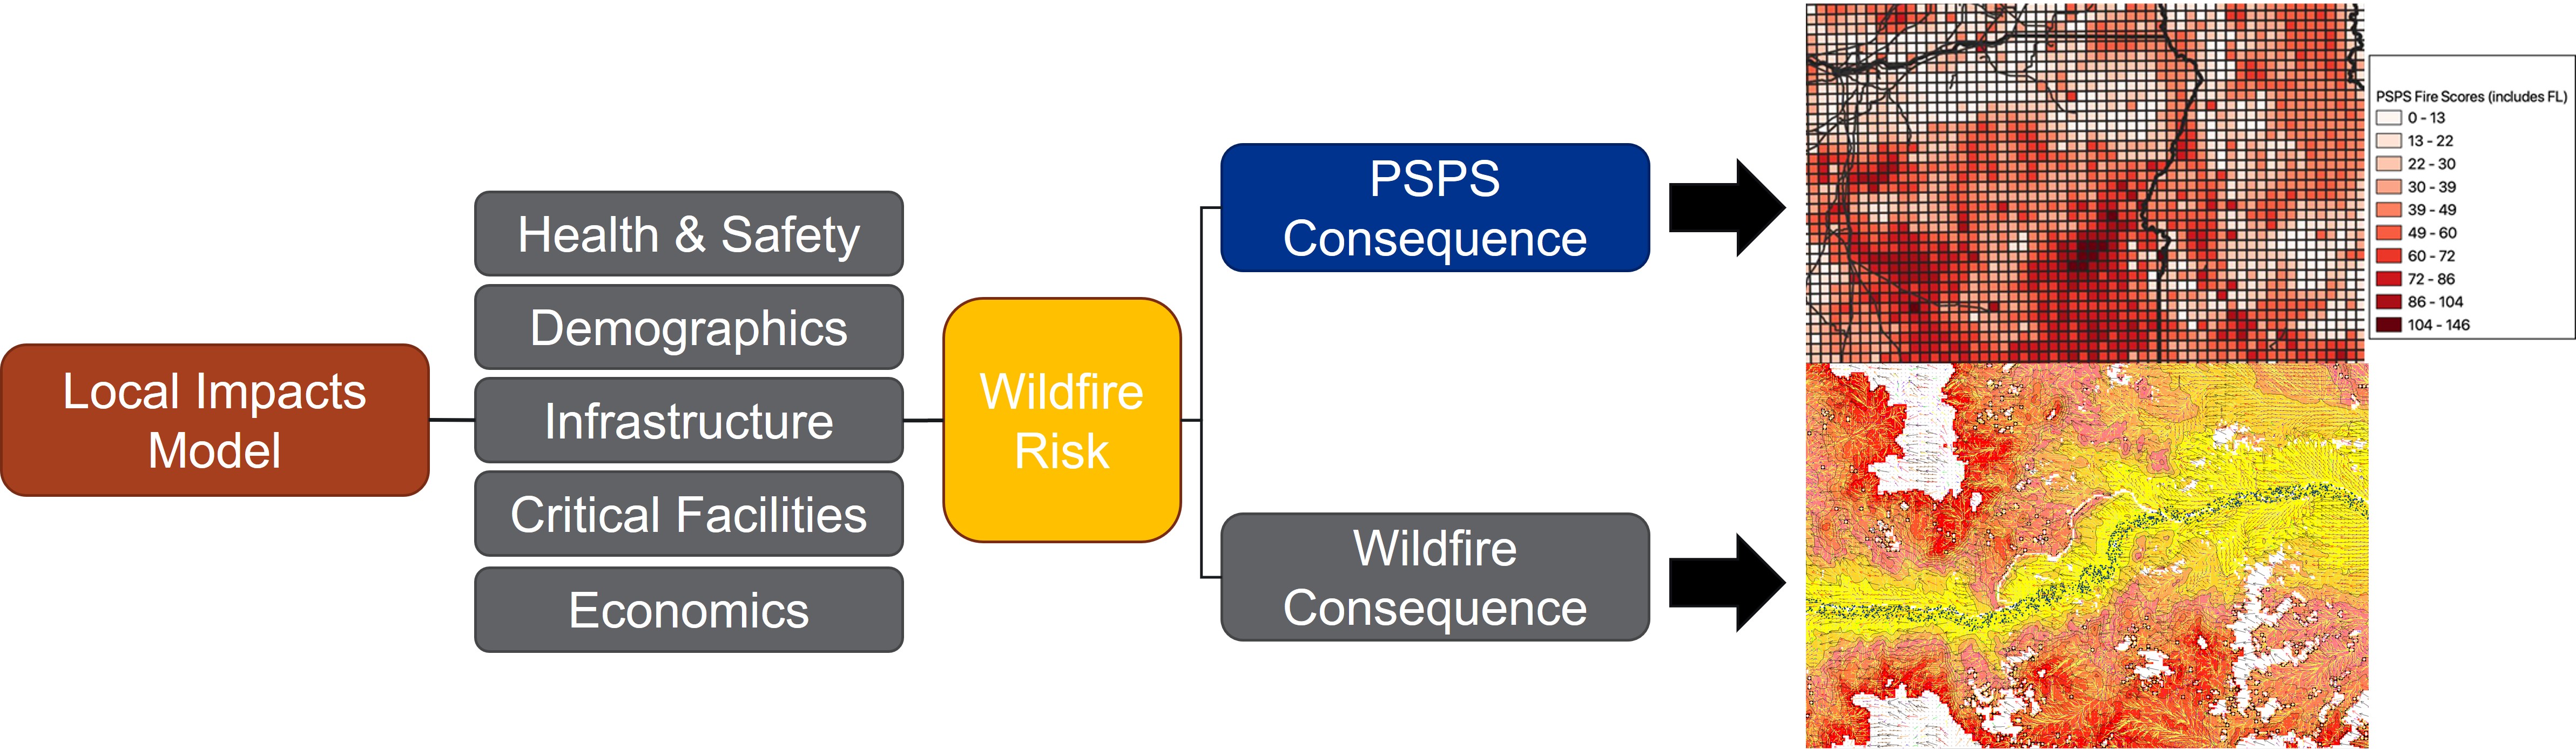
In response to increasing frequency and magnitude of wildfires, PNNL created the RADR-Fire system: a fully automated, cloud-based, AI-assisted system that consumes numerous types of high-resolution, open-access Earth observation satellite imagery and applies machine-learning algorithms to map the wildfire’s characteristics. The system produces geospatial data products through multiple endpoints (web data services, mobile phone app, web browser) for all fires in the continental United States, but is capable of providing analysis anywhere in the world. RADR-Fire has also expanded beyond response-phase disaster management to provide timely information on risk planning, mitigation, and consequence analysis that is particularly focused on critical energy infrastructure. The risk analysis is established with up-to-date satellite-based vegetation characterization and current and forecasted weather, which is then fed into fire behavior models. These risk data help inform and prioritize public safety power shutoff (PSPS) planning, infrastructure hardening, and other risk mitigation measures.
Rapid Event Mapping
Imagery assessed by RADR indicates where thermal hot spots are through cloud and smoke coverage. The imagery and assessment aids first responders in their fight against wildfires. To view the different stages in the process, click on the arrow to the right of the images. To read more information about the image, click the "i" icon in the bottom right of the picture.
1) Open-access, high-res (10-70 m pixel resolution) earth observation imagery is automatically retrieved for all NIFC-monitored fires in the U.S. The visible spectrum data (Blue, Green, Red) shown here is valuable for mapping smoke plumes but inhibits understanding wildfire characteristics at the surface.
(Image: ESA’s Sentinel-2; visible range)

2) The use of specialized sensors that can image beyond visible/near-infrared spectrums and into short-, mid-, and longwave infrared enables visibility through smoke plumes.
(Image: ESA’s Sentinel-2; shortwave-infrared range)

3) The cloud-based system applies AI models and algorithms to extract actionable data. For example, active fire front, spot fires, scattered heat, and post-burn intensity.
(Image: Pacific Northwest National Laboratory)

4) Time-series, geospatial data products viewable via a website and mobile app UI, retrievable via web service APIs for integrating into existing workflows
(Image: Pacific Northwest National Laboratory)
Benefits
Accurately forecasting the movement of natural disasters—wildfires, floods, hurricanes, tornados, and earthquakes—gives disaster managers and first responders a lead on response. RADR does this through:
- Up-to-date and high-resolution situational awareness that enables ongoing monitoring of static or dynamic events, which can greatly facilitate response efficiency and recovery efforts.
- An easily accessible cloud-based system that creates an automated pipeline for retrieving imagery, generating analytics, and disseminating data for use in a user’s own workflows.
- Visual analytics that produce intuitive images and analysis products easily used by responders.
- Builds on 20-plus years of PNNL expertise supporting sponsors in all-hazards response, recovery, and resilience.
- Used by the Department of Energy, Federal Emergency Management Agency, National Interagency Fire Center, U.S. Geological Survey, U.S. Agency for International Development, private industry, and numerous utilities.
Lab-Level Communications Priority Topics
Computing
Grid