
AMIA - Automated Microarray Image Analysis Toolbox for MATLAB®
The Automated Microarray Image Analysis (AMIA) Toolbox for MATLAB® is an image analysis tool for extracting microarray spot profiles from microarray images. The AMIA toolbox analyzes a set of microarray images with a common layout with minimal user input, and creates spot intensity estimates as well as numerous diagnostics pertaining to the quality of the data and the quality of the image analysis. The tool is open-source and designed to be as modular as possible, so that additional statistics and diagnostics can be added, or new algorithms for identifying or characterizing the spots can be implemented.
The AMIA Toolbox requires MATLAB 6.5 (R13) (Mathworks, Inc. Natick, MA) or a more recent version, as well as the Statistics Toolbox 4.1 and Image Processing Toolbox 4.1 for MATLAB.
Analysis Process
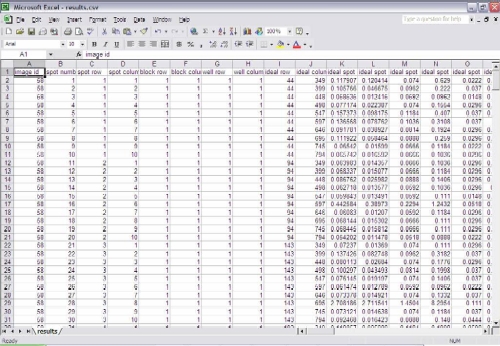
The AMIA Toolbox begins by prompting the user to enter slide layout information about the collection of images. This information is only entered once, and then stored in files to be used if analysis must be performed again. The application then asks the user for input to identify the spot spacing on an initial image. From this information, a grid of expected spot centers is created, which will be applied to each subsequent slide automatically. The spots are characterized using three different methods. The first method assumes the spots fall in a perfect grid and are identically shaped. This is the most naive method, but provides a starting point for two more sophisticated algorithms. The second method assumes that the spots are identically shaped, but may vary within a small neighborhood from the expected position. The third method uses a seeded region growing algorithm to dynamically determine the shape and size of each spot. For each of these three spot identification methods, summary statistics such as mean, median, standard deviation, background and spot size are calculated. Additional diagnostic statistics related to the shape of the spot are also calculated. These statistics are saved in comma-delimited text files.
For each image in the analysis set, a subdirectory is created to store the statistics for that image, as well as diagnostic images that are created. These diagnostic images include the expected spot centers, the size and position of identified spots for each of the three methods, typical spot shape, and the spot neighborhoods used to calculate background statistics. An HTML-based user interface is also created to allow the user to easily browse through the results for each image. Any errors or suspicious results are prominently flagged, so that the user does not have to dig through all results to find any problems.