Drought Impacts on Hydroelectric Power Generation in the Western United States
Drought Impacts on Hydroelectric Power Generation in the Western United States
Researchers at Pacific Northwest National Laboratory (PNNL) are examining the resilience of the western hydropower fleet to extreme drought. Studies include a retrospective analysis of more than two decades of data recorded at over 600 hydroelectric power plants across 11 states. Other studies consider future impacts to western hydropower under evolving climate conditions.
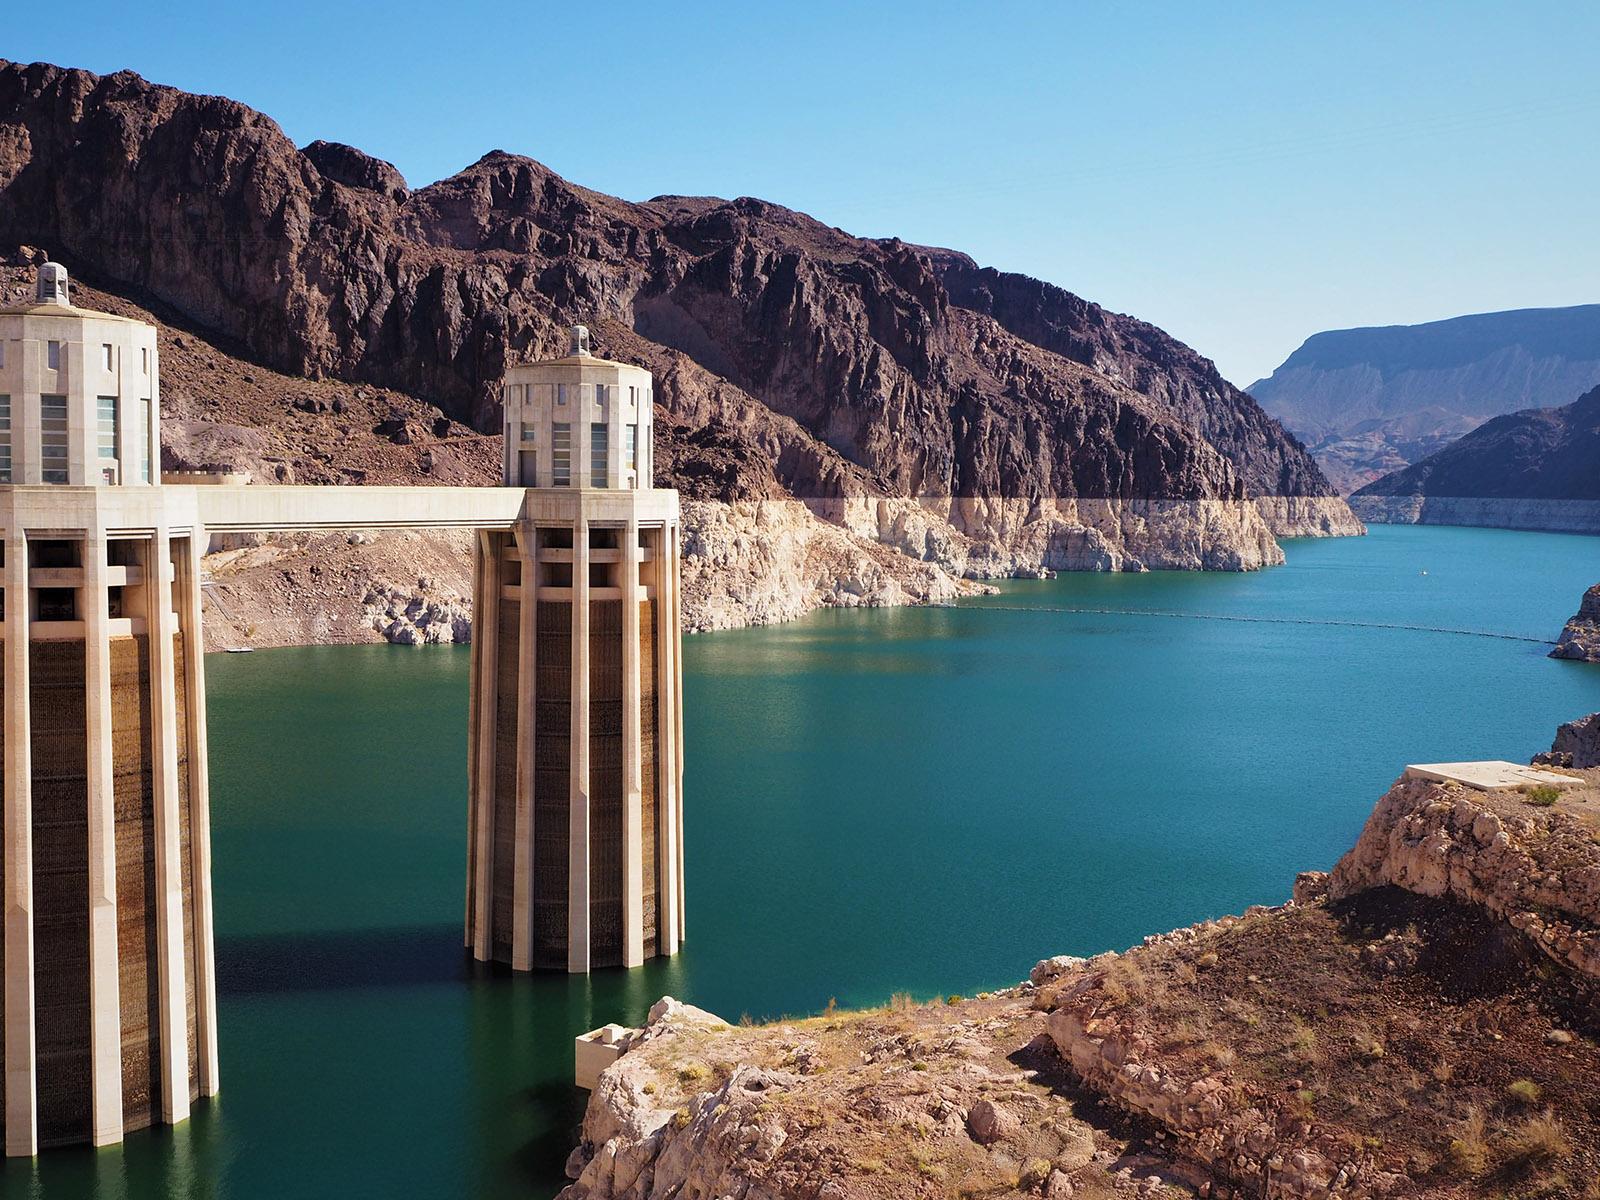
Drier conditions, such as those pictured here at Hoover Dam, could affect future hydroelectric power generation in the region.
(Photo by Katarzyna Przygodzka | Shutterstock.com)
Historical Perspective
Western climate is no stranger to drought
 |
Figure 1: Western U.S. monthly Palmer Drought Severity Index (PDSI) over the last 120 years (orange line gives smoothed trend). PDSI is a meteorological drought index based on precipitation and temperature and is used to assess the severity of dry or wet spells of weather. PSDI < -4 is often interpreted as extreme drought. (Data source: NOAA Monthly U.S. Climate Divisional Database; method described in Vose et al. [2014].) |
However, there is no such thing as a normal drought. The intensity and persistence of drought varies year to year and location to location.
Hydropower in the West
Like drought, hydropower production is unevenly distributed across the west. There are over 600 hydropower plants broadly scattered throughout the Western US (Figure 3). The number, size and operations of these plants vary by region (Table 1).
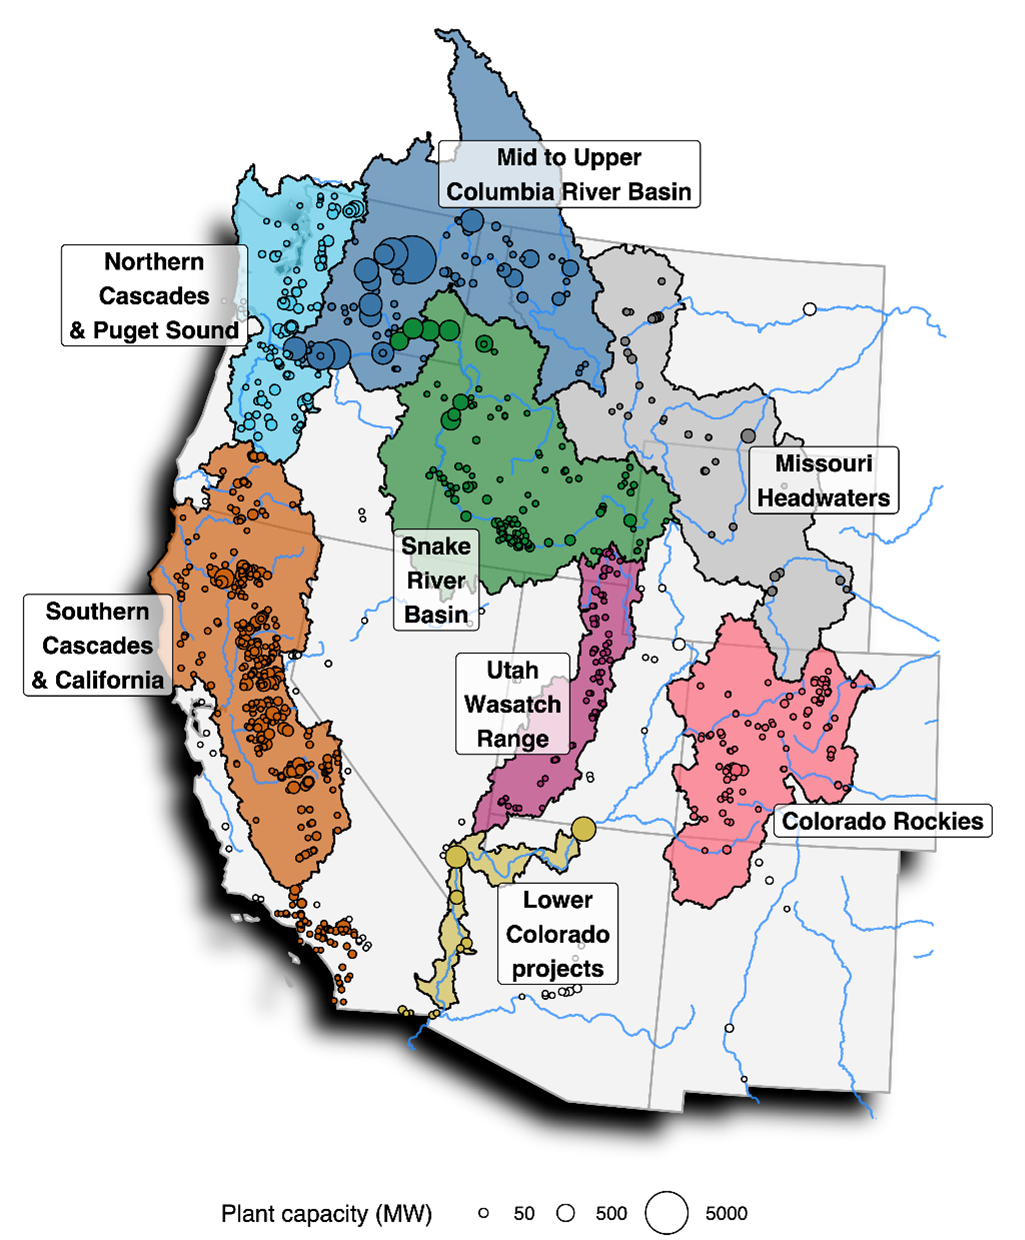 |
Figure 3: Eight hydropower climate regions of the West. Each point represents a hydroelectric plant (sized by plant capacity). Points matching region color but located beyond region boundaries (see Southern California) rely on water transferred from the relevant region (e.g., plants supplied by the All-American Canal from the Lower Colorado Projects). |
|
Hydropower climate region |
Share of western hydropower capacity |
Share of western hydropower generation |
Number of plants in study |
|
1. Mid to Upper Columbia River Basin |
44.8% |
50.9% |
55 |
|
2. South Cascades/California |
19.0% |
18.1% |
280 |
|
3. Snake River Basin |
11.7% |
11.1% |
81 |
|
4. Northern Cascades/Puget Sound |
10.3% |
10.0% |
73 |
|
5. Lower Colorado Projects |
7.6% |
5.5% |
15 |
|
6. Missouri Headwaters |
2.0% |
2.2% |
30 |
|
7. Colorado Rockies |
1.5% |
1.0% |
52 |
|
8. Utah Wasatch Range |
0.4% |
0.2% |
58 |
|
Total |
97.3% |
99.0% |
644 |
Hydropower climate regions of the West. Generation shares are based on 2001–2020 net generation annual observations.
From a historical perspective, drought has had a measurable impact on hydropower production in the West. However, the extent and character of that impact depends on the scale at which effects are evaluated. Figure 4 shows combined western hydropower production for the 21st century. Although effects of three distinct droughts are evident, 2001, 2015 and 2021, the western hydropower fleet was able to sustain four-fifths or more of its typical annual generation. This robust production is caused in part because drought rarely impairs hydropower generation across all western river basins at the same time.
 |
Figure 4: Total hydroelectric power generation in the United States. Western States are defined as WA, OR, CA, ID, MT, UT, CO, NV, AZ, WY, and NM. Percentage values in parentheses give deviation from mean annual western generation (dashed line). (Data source: EIA state-level generation reports. |
Drought impacts look different when viewed from individual river basins. Analysis of drought impacts on basin-level generation reveals six separate worst hydro drought years in the West during the 21st century. In fact, the year-to-year variation and degree of variation differ greatly between basins.

For more details on this retrospective analysis see: Turner et al. 2022 Drought impacts of hydroelectric power generation on the western United States